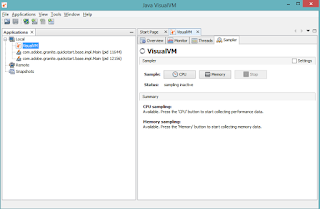
Statement : How to monitor the performance of AEM instance through Jconsole or JvisualVM
Pre-requisite:
- Make sure Java SDK/JRE 1.6/1.7/1.8 installed
- Make sure AEM instance is up and Running.
Solution:
- For windows system , open the CMD prompt.
- Type Jconsole or Jvisualvm or Visualvm for this example have used- Jvisualvm command
- After this you can select other options, including Monitor:
- Perform GC and Heap dump
- Monitor CPU, heap usage
- Monitor Live and Daemon threads.
- Take threaddump for any analysis
- Shows LIve and Daemon threads
- Shows running, Sleeping, wait,Park and Monitor.
- Perfrom CPU and Memory Sampling
- Perform GC and Heap dump
- Can take snapshots
- Within the local application as shown above,Double click on com.day.crx.quickstart.Main
- the Overview will be shown default.


How to monitor with ubuntu
ReplyDelete