What is AngularJS, Architecture & Features

  • AngularJS is an open source Model-View-Controller framework which is similar to theJavaScript framework.
  • Angular JS is probably one of the most popular modern day web frameworks available today.
  • This framework is used for developing mostly Single Page applications. This framework has been developed by a group of developers from Google itself.

In this tutorial, you will learn-
  • AngularJS Features
  • Angularjs Architecture
  • AngularJS Advantages

AngularJS Features

Angular has the following key features which makes it one of the powerful frameworks in the market.
  1. MVC – The framework is built on the famous concept of MVC (Model-View-Controller). This is a design pattern used in all modern day web applications. This pattern is based on splitting the business logic layer, the data layer, and presentation layer into separate sections. The division into different sections is done so that each one could be managed more easily.
  2. Data Model Binding – You don't need to write special code to bind data to the HTML controls. This can be done by Angular by just adding a few snippets of code.
  3. Writing less code – When carrying out DOM manipulation a lot of JavaScript was required to be written to design any application. But with Angular, you will be amazed with the lesser amount of code you need to write for DOM manipulation.
  4. Unit Testing ready – The designers at Google not only developed Angular but also developed a testing framework called "Karma" which helps in designing unit tests for AngularJS applications.

AngularJS Architecture

Angular.js follows the MVC architecture, the diagram of the MVC framework as shown below.
AngularJS: Introduction, Architecture, Advantages
Angularjs Architecture Diagram
  • The Controller represents the layer that has the business logic. User events trigger the functions which are stored inside your controller. The user events are part of the controller.
  • Views are used to represent the presentation layer which is provided to the end users
  • Models are used to represent your data. The data in your model can be as simple as just having primitive declarations. For example, if you are maintaining a student application, your data model could just have a student id and a name. Or it can also be complex by having a structured data model. If you are maintaining a car ownership application, you can have structures to define the vehicle itself in terms of its engine capacity, seating capacity, etc.

AngularJS Advantages

  • Since it's an open source framework, you can expect the number of errors or issues to be minimal.
  • Two-way binding – Angular.js keeps the data and presentation layer in sync. Now you don't need to write additional JavaScript code to keep the data in your HTML code and your data later in sync. Angular.js will automatically do this for you. You just need to specify which control is bound to which part of your model.
AngularJS: Introduction, Architecture, Advantages
  • Routing – Angular can take care of routing which means moving from one view to another. This is the key fundamental of single page applications; wherein you can move to different functionalities in your web application based on user interaction but still stay on the same page.
  • Angular supports testing, both Unit Testing, and Integration Testing.
  • It extends HTML by providing its own elements called directives. At a high level, directives are markers on a DOM element (such as an attribute, element name, and comment or CSS class) that tell AngularJS's HTML compiler to attach a specified behavior to that DOM element. These directives help in extending the functionality of existing HTML elements to give more power to your web application.

10 Best Tableau Alternatives & Competitors in 2019

Tableau is a data visualization tool that can connect to almost any data source. However, its licensing costs could be restrictive.
Here, is a curated list of top 10 tools that can replace Tableau. This list includes commercial as well as open-source automation tools with popular features and latest download link.

1) Sisense:

Sisense is a business intelligence tool which analyses and visualizes both big and disparate datasets, in real-time. It is an ideal tool for preparing complex data for creating dashboards with a wide variety of visualizations.
Features:
  • Unify unrelated data into one centralized place
  • Create a single version of truth with seamless data
  • Allows to build interactive dashboards with no tech skills
  • Query big data at very high speed
  • Possible to access dashboards even in the mobile device
  • Drag-and-drop user interface
  • Eye-grabbing visualization
  • Enables to deliver interactive terabyte-scale analytics
  • Exports data to Excel, CSV, PDF Images and other formats
  • Ad-hoc analysis of high-volume data
  • Handles data at scale on a single commodity server
  • Identifies critical metrics using filtering and calculations

2) Oracle:

Oracle data warehouse software is a collection of data which is treated as a unit. The purpose of this database is to store and retrieve related information. It helps the server to reliably manage huge amounts of data so that multiple users can access the same data.
Features:
  • Distributes data in the same way across disks to offer uniform performance
  • Works for single-instance and real application clusters
  • Offers real application testing
  • Common architecture between any Private Cloud and Oracle's public cloud
  • Hi-Speed Connection to move large data
  • Works seamlessly with UNIX/Linux and Windows platforms
  • It provides support for virtualization
  • Allows connecting to the remote database, table, or view

3) SAS:

SAS is a leading Datawarehousing tool that allows accessing data across multiple sources. It can perform sophisticated analyses and deliver information across the organization.
Features:
  • Activities managed from central locations. Hence, user can access applications remotely via the Internet
  • Application delivery typically closer to a one-to-many model instead of one-to-one model
  • Centralized feature updating, allows the users to download patches and upgrades.
  • Allows viewing raw data files in external databases
  • Manage data using tools for data entry, formatting, and conversion
  • Display data using reports and statistical graphics

4) Pentaho

Pentaho is a Data Warehousing and Business Analytics Platform. The tool has a simplified and interactive approach which empowers business users to access, discover and merge all types and sizes of data.
Features:
  • Enterprise platform to accelerate the data pipeline
  • Community Dashboard Editor allows the fast and efficient development and deployment
  • Big data integration without a need for coding
  • Simplified embedded analytics
  • Visualize data with custom dashboards
  • Ease of use with the power to integrate all data
  • Operational reporting for mongo dB
  • Platform to accelerate the data pipeline

5) QlikView:

Qlik allows creating visualizations, dashboards, and apps. It also allows seeing the entire story that lives within data.
Features:
  • Simple drag-and-drop interfaces to create flexible, interactive data visualizations
  • Use natural search to navigate complex information
  • Instantly respond to interactions and changes
  • Supports multiple data sources and file types
  • It allows easy security for data and content across all devices
  • It shares relevant analyses, including apps and stories using centralized hub
Download link: http://www.qlik.com

6) Dundas BI:

Dundas is an enterprise-ready Business Intelligence platform. It is used for building and viewing interactive dashboards, reports, scorecards and more. It is possible to deploy Dundas BI as the central data portal for the organization or integrate it into an existing website as a custom BI solution.
Features:
  • Easy access through web browser
  • Allows to use sample or Excel data
  • Server application with full product functionality
  • Integrate and access all kind of data sources
  • Ad hoc reporting tools
  • Customizable data visualizations
  • Smart drag and drop tools
  • Visualize data through maps
  • Predictive and advanced data analytics

7) BOARD:

Board is a Management Intelligence Toolkit. It combines features of business intelligence and corporate performance management. It is designed to deliver business intelligence and business analytics in a single package.
Features:
  • Analyse, simulate, plan and predict using a single platform
  • To build customized analytical and planning applications
  • Board All-In-One combines BI, Corporate Performance Management, and Business analytics
  • It empowers businesses to develop and maintain sophisticated analytical and planning applications
  • Proprietary platform helps to report by accessing multiple data sources
Download link: http://www.board.com/en

8) Profitbase BI:

Profitbase is a business intelligence solution that delivers critical business information. It allows companies to monitor and manage their business performance. It is appropriate for many commercial markets, including manufacturing and retail.
Features:
  • It helps make faster decisions based on continuously updated and accurate data
  • It provides visibility into KPIs in finance, sales, AR/AP, as well as performance measures
  • It is modular, scalable, and consists of a data warehouse augmented with OLAP cubes
  • The BI software allows adding new business systems through acquisition or system upgrades
  • It is a module based BI tool so that customers can select the analytic tools best suited for their requirements

9) LongView:

LongView Enterprise is a business intelligence reporting and analytics platform. It allows rapid creation of custom applications like reports, dashboards, etc.
Features:
  • Delivers actionable, contextual knowledge to decision-makers at every level
  • It analyzes information from multiple data sources such as ERP, OLAP, relational databases, and web services
  • Single-sign-on if integrated with Windows or LDAP
  • It is available on all web servers
  • It allows exporting data and reports to Excel, PowerPoint, and PDF
  • It allows users to share ad-hoc reports with other users
  • Live data pulled from server and automatically refreshed in real time
  • Automatic alerts based on thresholds
  • Display data in animation and motion charts
Download link: http://www.longview.com/

10) Birst:

Birst is a web-based networked BI and analytics solution. It connects insights from various teams and helps in making informed decisions. It allows decentralized users to augment the enterprise data model. It also offers a unified semantic layer to maintain definitions and key metrics.
Features:
  • Enable Data as a Service
  • Everyone is Cloud-Connected
  • Helps end users to access and blend their data with IT-owned data
  • Rapidly refine enterprise data
  • Create trusted, governed user data
  • Create corporate wide metrics
  • Create top-down Virtual BI instances
  • Blend corporate and local data
  • It supports individual agility, transparently governed working with trusted corporate and departmental data
Download link: https://www.birst.com/

11) SAP BUSINESS INTELLIGENCE:

SAP BI is an integrated business Intelligence software. It is an enterprise level application for open client/server systems. It has set new standards for providing the best business information management solutions.
Features:
  • It provides highly flexible and most transparent business solutions
  • The application developed using SAP can integrate with any system
  • It follows modular concept for the easy setup and space utilization
  • Allows to create next-generation database system that combines analytics and transactions
  • Provide support for On-premise or cloud deployment
  • Simplified data warehouse architecture
  • Easy Integration with SAP and non-SAP applications

Tableau Connections to Multiple Data Sources & Replacing Data Source


In this tutorial, you will learn-
  • Connecting to various data sources
  • Connection to Text File
  • Connecting to Excel File
  • Connection to Database
  • Connection to Websites
  • Connecting to Tableau Server
  • Data Relationship
  • Data Sorting
  • Replacing Data Source

Connecting to various data sources

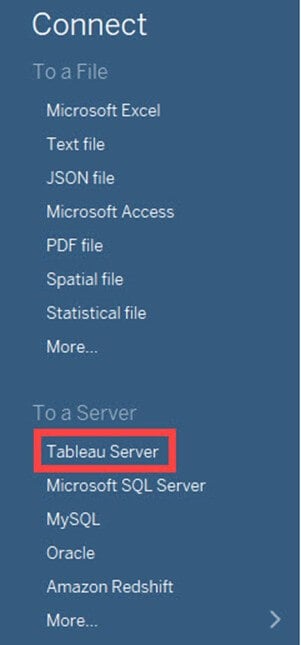
Tableau can connect to various types of data sources. It can connect to text files, excel files, PDF files, etc. It can also connect to various databases using its ODBC connector. Tableau has the capability to connect to servers and web connectors. In this tutorial, we will learn about the connection procedures from various data sources.
Following screenshot gives the exhaustive connection types Tableau supports

Connection to Text File

Step 1) Click on the "Text File" option given in the data tab.
Step 2) In the next screen,
1. Select the SuperStore.csv
2. Click on "Open" Option. This will connect the text file into Tableau.
In the left pane you will see the CSV file.

Connecting to Excel File

Step 1) Click on the "Microsoft Excel" option given in the data tab.
Step 2) In the next screen,
  1. Select the SuperStore.xlxs
  2. Click on "Open" Option.
Step 3) It connects the excel file into Tableau. The sheets present in the excel file is shown on the left side of the window.

Connection to Database

Step 1) Click on the required database connection given in the data tab. For example, if you want to connect to MySQL database, click on the "MySQL" Option.
Step 2) This will open MySQL connection window.
  1. You can enter the MySQL server name and edit the "Port" if needed.
  2. Enter the username and password used to connect the database.
  3. Click on the "Sign in" button to connect to the database.
This procedure connects the database into the Tableau. You can select the tables from the database and import it into Tableau. You can join multiple tables by creating a relationship between them.

Connection to Websites

Tableau can connect to websites using web connector. The connection procedure is given as follows.
Step 1) In this window,
  1. Click on "More" option in the data tab.
  2. Select "Web Data Connector" from the list.
Step 2) This will open a Web Data Connector window where you need to enter the web connector details.

Connecting to Tableau Server

Tableau Server can store extracted data sources and database connections. In enterprise level, it is important to keep all the required data connections in Tableau Server. It helps all the users of the enterprise to connect to the data source easily. The data sets in the Tableau Server can connect to Tableau Desktop by following the given procedures.
Step 1) Select the "Tableau Server" option given in the data tab.
Step 2) This opens the Tableau Server Sign in window. Click on 'Tableau Online' option.
Step 3) It opens Tableau Online Sign In Window.
  1. Enter the registered email id and password.
  2. Click on 'Sign In' button.
Step 4) This will connect Tableau Server into Tableau Desktop.
  1. Select the data set as shown in the figure.
  2. This will import the dataset into Tableau.

Data Relationship

A relational Database/Excel file consists of multiple Tables/sheets. These multiple tables/sheets can be connected to each other in Tableau. This connection is established by 'Join' or 'Union' feature present in Tableau. The relationship between data in two or more tables needs to be specified while joining tables.
Joins:
Tableau can "join" tables. It can join up to 32 tables in a data source. While joining, the relationship between two or more tables can be specified. The tables present in the data source can be related to each other using the joins such as inner join, left join, right join and outer join. The functionalities of Join types are explained in the table below,
Inner Join
Left Join
Right Join
Outer Join
It joins all the common records between two tables or sheets. The joining condition can be given based on the primary key. One or more joining conditions can be specified to join the tables. Many tables can be joined together in Tableau for visualization.
A left join is used to join all the records from a left table and common records from the right table. One or more join conditions can be specified to left join two different tables.
A right join is used to join all the records from a right table and common records from left table. Based on the requirements, one or more joining condition can be set.
An Outer join is used to join all the records from both left and right table. Joining conditions can be set to join common records.
Let's see an example of Join
Step 1) Once an Excel is connected, Drag the required sheet into data window as shown in the figure.
Step 2) You can connect multiple sheets by dragging the sheets into the data window. The relationship between the sheets can be given by connecting the data fields.
Step 3) In the data sheet
  1. Click on the "Join" option as shown in the figure. By default, Tableau joins two tables by connecting a relationship between common column present in it.
  2. You can edit the relationship by selecting the required joining Condition.
  3. You can add one or more data relationship between the sheets or tables.
Union
Union is used to append the data from two or more tables. In most of the cases, tables with same headers are appending together using union function. Joining conditions are not required while union two or more tables. The procedure to union tables are given as follows.
Step 1) Drag any of the sheet into data window as shown in the figure.
Step 2) Right click on the sheet and select "Covert to Union" option.
Step 3) In the data union window.
  1. Drag other sheets which need to be union.
  2. Click on 'OK' to append or union all the sheets present in the window.
A data relationship is not needed to union sheets present in the data source.

Data Sorting

Data present in the data source can be sorted based on the user requirement. It can be sorted using data source order, ascending, descending, ascending per table and descending per table.
Once the data is connected to Tableau, data sorting can be done using the "Sort Fields" option. The option is present in the "Data Source" tab.

Replacing Data Source

Tableau can connect multiple data sources in a single workbook. The different data sources can be used to build various sheets and dashboards in Tableau. In some cases, data sources need to be replaced with updated file. Tableau has a data source replacing feature which can replace data sources. This feature does not affect the already built visualizations using the old data source. It is important to keep or replace all the used dimensions and measures while replacing the data source.
The data source connected in Tableau can be replaced with another data source. The procedure for replacing data source is given as follows.
Step 2)
  1. Select the Data Source to be replaced.
  2. Right-click on the data source and select "Replace Data Source" option.
Step 3) It opens the data source replacement window.
1. Select the current
2. Select replacement data source.
3. Click on "OK" to replace the data source.

Summary

  • Tableau can connect to various data sources like Excel, databases, and websites.
  • It can join various sheets or tables present in the data source.
  • The joining conditions used in Tableau are an inner join, right join, left join and outer join.
  • Tableau can connect and join various sheets present in an excel file.
  • The database can be connected to Tableau by connecting the database server.
  • Tableau can connect websites by using web connector.
  • Data sorting is available in the Tableau's data source Tab.
  • Tableau Server can be connected to Tableau Desktop.