Showing posts with label AEM Log. Show all posts

AEM_Types of Audit log

  1. 1. AEM WCM Audit records:
  • Audit records are held to provide a record of who did what and when.
  • Open a page.
  • From the sidekick you can select the tab with the lock icon, then double-click on Audit Log...
  • A new window will open showing the list of audit records for the current page.
    • Click OK when you want to close the window.

    2. AEM WCM Auditing records within the repository

    • Within the /var/audit folder, audit records are held according to the resource. 
    • You can drill down until you can see the individual records and the information they contain.
    • These entries hold the same information as shown when editing a page.

    3. OSGi Audit records from the Web Console

    • OSGi events also generate audit records which can be seen from the Configuration Status tab -> Log Files tab in the Adobe CQ Web Console:


    AEM_log Level 0 to level 3 meaning

    The log levels are as follows:
    0Fatal errorThe action has failed, and the installer cannot proceed.
    1ErrorThe action has failed. The installation proceeds, but a part of AEM WCM was not installed correctly and will not work.
    2WarningThe action has succeeded but encountered problems. AEM WCM may or may not work correctly.
    3InformationThe action has succeeded.

    AEM_Log files Basics


    Various log files are held on the file server where you installed AEM:
    • <cq-installation-dir>/crx-quickstart/logs
      • access.log
        All access requests to AEM WCM and the repository are registered here.
      • audit.log
        Moderation actions are registered here.
      • error.log
        Error messages (of varying levels of severity) are registered here.
      • ImageServer--yyyy>--
        .log

        This log is only used if dynamic media is enabled. It provides statistics and analytical information used for analyzing behavior of the internal ImageServer process. 
      • request.log
        Each access request is registered here together with the response.
      • s7access---
        .log

        This log is only used if dynamic media is enabled. The s7access log records each request made to Dynamic Media through /is/image and /is/content.
      • stderr.log
        Holds error messages, again of varying levels of severity, generated during startup. By default the log level is set to Warning (WARN)
      • stdout.log
        Holds logging messages indicating events during startup.
      • upgrade.log
        Provides a log of all upgrade operations that runs from the com.day.compat.codeupgrade and com.adobe.cq.upgradesexecutor packages.
    • <cq-installation-dir>/crx-quickstart/repository
      • revision.log
        Revision journaling information.
    Note:
    The ImageServer and s7access logs are not included in the Download Full package that is generated from the system/console/status-Bundlelist page. For support purposes, if you have Dynamic Media issues, please also append the ImageServer and s7access logs when you contact Customer Support.

    Why Replication Logs

    Statement - Why Replication log configuration is needed

    Pre-requisite :
                         -  AEM 6.1
    Solution :

    Why:
           Keeps error.log from getting bloated
           Isolates replication errors and warnings
    How:
           Go to Felix console and search for Apache Sling Logging Logger:
           Log File: logs/replication.log
           Log Level: Info
           Logger: com.day.cq.replication
           Add an Apache Sling Logging Writer (for log rotation)

           Log File: logs/replication.log

    How to prevent expansive queries from overloading the systems in AEM 6.1


    Statement - How to  prevent expansive queries from overloading the systems

     Environment :
                             - AEM 6.1


    Solution:

    Add these JVM parameters in the AEM start script to prevent expansive queries from overloading the systems.

    -Doak.queryLimitInMemory=500000
    -Doak.queryLimitReads=100000
    -Dupdate.limit=250000
    -Doak.fastQuerySize=true

    JVM arguments related findings

    Finding ID
    Title
    Total Risk
    Effort to fix
    JVM1
    Doak.queryLimitInMemory
    High
    Low
    JVM2
    Doak.queryLimitReads
    Medium
    Low
    JVM3
    Dupdate.limit
    Medium
    Low
    JVM4
    Doak.fastQuerySize
    High
    Low

    How to Suppress the Informational Log messages from a specific class file in a log


    Statement - How to Suppress the Informational Log messages in log file to avoid the growing of log files.

    Pre-requsite :
    • JRE 1.8
    • AEM 6.3 up and running.
    Issues :
    • This cause log to  Bloat
    • storage cost and additional CPU cycles
    • Increasing Disk I/O
    • Leads to frequent mainatence
    Solution :
    • Go to log file and find the INFO log messages in the log files and identify which INFO log messages are getting generated and log file is filled with.
    • Identify the classname - Example : 11.05.2018 17:07:04.463 *INFO* [0:0:0:0:0:0:0:1 [1526029594249] GET /aem/start.html HTTP/1.1] com.adobe.granite.ui.clientlibs.impl.HtmlLibraryManagerImpl detected [JS] library: /libs/cq/gui/components/common/wcm/clientlibs/wcm, sourced from 13 files.

    • Go to Felix console : /system/console/configmgr
    • Search for Apache Sling Logging Logger Configuration
    • Click on +icon to create new logging configuration for com.adobe.granite.ui.clientlibs.impl.HtmlLibraryManagerImpl
    • Set Log level to WARN
    • Under Logger enter the classname com.adobe.granite.ui.clientlibs.impl.HtmlLibraryManagerImpl
    • Save the changes
    • That's it, all info messages from the class file which are logged into the error.log will be suppressed


    How to find where all a particular AEM comportment used in the page of website


    • Statement - find the component usage across the website

    Pre-requiste : 
            -  AEM 6.3 up and running

    Solution :

    Option-1:
    • Open any page in the touch UI
    • On page open -> switch to Developer view
    • On the toggle side panel click on the component
    • Click on the view component details as shown below 


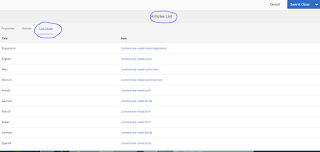
    • Click on the Live usage tab to see where all the article component is used


    Option- 2 :


    • Go to touch UI - Tools-->General tab--> click on components (https://localhost:/libs/wcm/core/content/sites/components.html
    • Click on the any of the component  

    • Click on Live Usage Tab to see where all this component is used.


    How to find AEM component load time in a page

    Statement - How to find AEM component load time in a page

    Pre-requisite :

    • AEM 6.3 server up and running
    • JRE 1.8

    Solution :


    • Go to the any page of the site for example http://localhost:/editor.html/content/we-retail/us/en/experience.html
    • On page switch to developer view 
    • On same page click on toggle side panel --> click on the component.
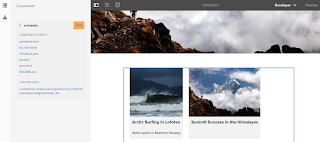
    • Now select any one of the component,As per this example selecting ArtcleList component shown in Screenshot.

    • In the left side panel Article list component shows the total load time for this component is 0.017 ms
    • Now if you want see the details of this component click on the copy icon under the Articlelist component which 
                           - Shows list of scripts included for this component.
                           - Content Path for this component.
                           - On click on each of the script file takes you to the CRX/de light console


      • Click on pencil icon will take you to the Articlelist component script in crx/de light console and you can tune the application code if response time is low.

      • Below screenshot shows the load time in millisecond for different components used in the experience.html page