How to Download & Install Tableau Desktop: Workspace, Navigation


Tableau is available in 2 versions
  1. Tableau Public (Free)
  2. Tableau Desktop (Commercial)
Here is a detailed comparison between the two
Tableau DesktopTableau Public
PricingPersonal Edition - $35 per month Professional Edition - $70 per monthFree and Open Source
Data Source ConnectionConnect to any data source files including databases, web applications and moreConnect to Excel and text files
Publish/SaveCan be saved as a local file and can be published in Tableau Server and Tableau OnlineCan be published only in Tableau Public profile
OSWindows and MacWindows and Mac
SecurityData and Visualizations are securedData and visualizations are not secured as it is available in public
Usage DetailsProfessional and Enterprise levelPersonal level
Data ExtractData can be extracted from various data sources and stored as Tableau extract fileData cannot be obtained from different data sources as it is limited to connect only excel and text files.
To execute the examples in these tutorials, you will need access to Tableau Desktop. We will go through the steps the install Tableau Desktop on a Windows Machine. It has a 14-day trial.
In this tutorial, you will learn
  • Tableau is available in 2 versions
  • Download and Install Tableau Desktop
  • Tableau Desktop Workspace
  • Tableau Navigation

Download and Install Tableau Desktop

Step 1) Go to https://www.tableau.com/products/desktop on your web browser.
Step 2) Click on the "TRY NOW" button shown in the top right corner of the website.
Step 3) It will redirect to the page where you need to enter your email id and click on "DOWNLOAD FREE TRIAL" button.
Step 4) This will start downloading the .exe file for Windows by default, and you can see the downloading process in the bottom left corner of the website.
Step 5) Open the downloaded file. Check in to accept the terms and conditions and click on "Install" button.
Step 6) A optional pop-up message will be shown to get the approval of Administrator to install the software. Click on "Yes" to approve it. Installation of the Tableau Desktop on Windows system starts
Step 7) Once the installation is completed, open the Tableau Desktop software.
Step 8) In the Registration window
  1. Click on Activate Tableau and entire your license details
  2. If you do not have a license, enter your credentials
  3. Click on Start Trial now
Step 9) Wait for registration to complete
Step 10) Start Screen of Tableau is shown
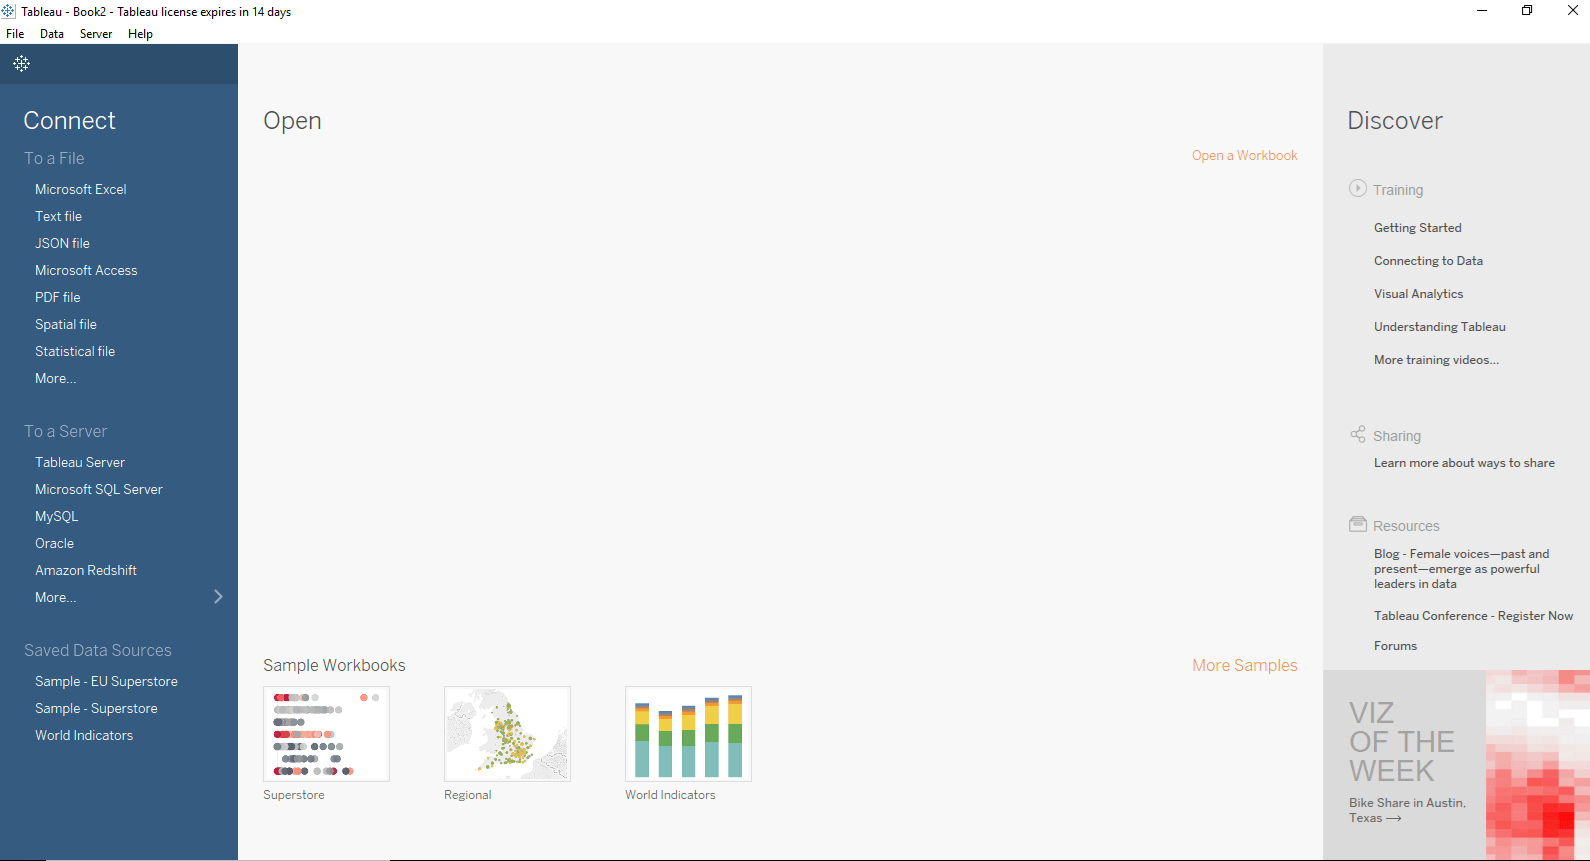
Now you are all set to use the Tableau Desktop in your windows system.

Tableau Desktop Workspace

In the start screen, go to File > New to open a Tableau Workspace
The Tableau Desktop Workspace consists of various elements as given in the figure:
Menu Bar:
It consists of menu options such as File, Data, Worksheet, Dashboard, Story, Analysis, Map, Format, Server, and Windows. The options in the menu bar include features such as file saving, data source connection, file export, table calculation options, and design features for creating a worksheet, dashboard, and storyboard.
Toolbar Icon:
Toolbar icon present below the menu bar can be used to edit the workbook using different features such as undo, redo, save, new data source, slideshow and so on.
Dimension Shelf:
The dimensions present in the data source can be viewed in the dimension shelf.
Measure Shelf:
The measures present in the data source can be viewed on the measure shelf.
Sets and Parameters Shelf:
The user-defined sets and parameters can be viewed in the sets and parameter shelf. It can also be used to edit the existing sets and parameters.
Page Shelf:
Page shelf can be used to view the visualization in video format by keeping the relevant filter on the page shelf.
Filter Shelf:
The filters that can control the visualization can be placed on the filter shelf, and the required dimensions or measures can be filtered in.
Marks Card:
Marks card can be used to design the visualization. The data components of the visualization such as color, size, shape, path, label, and tooltip used in the visualizations can be modified in the marks card.
Worksheet:
The worksheet is the place where the actual visualization can be viewed in the workbook. The design and functionalities of the visual can be viewed in the worksheet.
Tableau Repository:
Tableau repository is used to store all the files related to tableau desktop. It includes various folders such as Bookmarks, Connectors, Datasources, Extensions, Logs, Mapsources, Services, Shapes, TabOnlineSyncClient and Workbooks. My Tableau repository is usually located in the file path C:\Users\User\Documents\My Tableau Repository.

Tableau Navigation

The navigation of workbook is explained below.
Data Source:
The addition of new data source of modification of existing data source can be done using the 'Data Source' tab present at the bottom of the Tableau Desktop Window.
Current Sheet:
Current Sheet can be viewed with the name of the sheet. All the sheets, dashboards and story board present in the workbook can be viewed here.
New Sheet:
The new sheet icon present in the tab can be used to create a new worksheet in the Tableau Workbook.
New Dashboard:
The new dashboard icon present in the tab can be used to create a new dashboard in the Tableau Workbook.
New Storyboard:
The new storyboard icon present in the tab can be used to create new storyboard in the Tableau Workbook.

Tableau Server is designed in a way to connect many data tiers. It can connect clients from desktop, mobile, and web. Tableau Desktop is a robust data visualization tool. It is highly available and secure.
It can run on both virtual and physical machines. It is a multi-user, multi-process and multi-threaded system.
Providing such powerful features requires a robust architecture. Let's study the Tableau Server Architecture in this tutorial.
In this tutorial, you will learn
  • Tableau Server Architecture
  • Data Server
  • Data Connectors
  • Components of Tableau Server
  • Gateway
  • Clients

Tableau Server Architecture

The various layers used in the Tableau server are given in the following architecture diagram
Figure 1 Tableau Architecture Diagram
Let's study the different components of Tableau Architecture
  1. Data Server

The primary component of Tableau Architecture is the Data sources it can connect to it.
Tableau can connect to multiple data sources. These data sources can be on-premise or remotely located. It can connect to a database, excel file, and a web application all at the same time. Tableau can connect data from heterogeneous environments. It can blend the data from multiple data sources. It can also make the relationship between various types of data sources.
  1. Data Connectors

The Data Connectors provide an interface to connect external data sources to Tableau Data Server.
Tableau has in-built ODBC/SQL connector. This ODBC Connector can connect to any databases without using their native connector. Tableau has an option to select both live and extract data. Based on the usage, one can be easily switched between extracted and live data.
  • Live Connection or Real time data: Tableau can connect to real time data by linking to the external database directly. It uses the infrastructure of existing database system by sending dynamic MDX (Multidimensional Expressions) and SQL statements. This feature can link to the live data with Tableau rather than importing the data. It makes good the investment done by an organization on a fast and optimized database system. In many enterprises, the size of the database is huge and is updated periodically. In those cases, Tableau works as a front-end visualization tool by connecting to the live data.
  • Extracted or In-memory data: Tableau has an option to extract the data from external data sources. We can make a local copy in the form of tableau extract file. It can extract millions of records in Tableau data engine with a single click. Tableau's data engine uses storage such as RAM, ROM and cache memory to store and process data. Using filters, Tableau can extract few records from a huge dataset. This improves the performance, especially while working on massive datasets. Extracted or in-memory data allows the users to visualize the data offline, without connecting to the data source.
  1. Components of Tableau Server

The different components present in a Tableau server are:
  • Application Server
  • VizQL Server
  • Data Server
A) Application Server:
The application server is used to provide the authentications and authorizations. It handles the administration and permission for web and mobile interfaces. It assures security by recording each session id on Tableau Server. The administrator can configure the default timeout of the session in the server.
B) VizQL Server:
VizQL server is used to convert the queries from the data source into visualizations. Once the client request is forwarded to VizQL process, it sends the query directly to data source and retrieves information in the form of images. This image or visualization is presented to the user. Tableau server creates a cache of visualization to reduce the load time. The cache can be shared across many users who have the permission to view the visualization.
C) Data Server:
Data server is used to manage and store the data from external data sources. It is a central data management system. It provides metadata management, data security, data storage, data connection and driver requirements. It stores the relevant details of data set such as metadata, calculated fields, sets, groups, and parameters. The data source could extract data as well make live connections to external data sources.
  1. Gateway

The gateway channelizes the requests from users to Tableau components. When the client makes a request, it is forwarded to external load balancer for processing. The gateway works as a distributor of processes to various components. In case of absence of external load balancer, gateway also works as a load balancer. For single server configuration, one primary server or gateway manages all the processes. For multiple server configurations, one physical system works as primary server while others are used as worker servers. Only one machine can be used as a primary server in Tableau Server environment.
  1. Clients

The dashboards and visualizations in Tableau server can be viewed and edited using different clients. The Clients are Tableau Desktop, web browser and mobile applications.
Clients
Environment
Tableau Desktop
Tableau Desktop is a business analytics tool. It helps to create, view and publish dashboards in Tableau Server. Users can access various data sources and build visualizations in Tableau Desktop.
Mobile
The dashboards from the server can be interactively visualized using mobile browsers and applications. The browser and application can be used to view and edit the contents in the workbook.
Web
Web browsers such as Google Chrome, Safari, Firefox and internet explorer support the Tableau server. The contents and visualizations in the dashboard can be edited through these web browsers.

Summary:

  • The architecture of Tableau Server is designed to connect different data sources securely.
  • Data Server is the first layer in the architecture. It helps Tableau to connect data in various heterogeneous environments.
  • Data connector is the second layer. It helps to connect to various databases using its ODBC connector.
  • Tableau can connect the real time live data by connecting the database directly. It can also extract a local copy of data through its in-memory data store for faster processing.
  • The components such as Application Server, VizQL Server, and data server act as the third layer.
  • The application server is used for authentications and authorizations.
  • VizQL is used to convert the SQL query into visualizations.
  • Data Server is a centralized data management system used in the architecture.
  • A gateway is used to distribute the processes into different components.
  • The fourth layer of the architecture are the clients such as Tableau Desktop, web and Mobile.

What is Tableau

What is Tableau?

Tableau is a powerful and fastest growing data visualization tool used in the Business Intelligence Industry. It helps in simplifying raw data into the very easily understandable format.
Data analysis is very fast with Tableau and the visualizations created are in the form of dashboards and worksheets. The data that is created using Tableau can be understood by professional at any level in an organization. It even allows a non-technical user to create a customized dashboard.
The best feature Tableau are
  • Data Blending
  • Real time analysis
  • Collaboration of data
The great thing about Tableau software is that it doesn't require any technical or any kind of programming skills to operate. The tool has garnered interest among the people from all sectors such as business, researchers, different industries, etc.
In this tutorial, you will learn-
  • What is Tableau?
  • Tableau product suite
  • Tableau Desktop
  • Tableau Public
  • Tableau Server
  • Tableau Online
  • Tableau Reader
  • How does Tableau work?
  • Excel Vs. Tableau

Tableau Product Suite

The Tableau Product Suite consists of
  • Tableau Desktop
  • Tableau Public
  • Tableau Online
  • Tableau Server
  • Tableau Reader
For clear understanding, data analytics in tableau can be classified into two section
  1. Developer Tools: The Tableau tools that are used for development such as the creation of dashboards, charts, report generation, visualization fall into this category. The Tableau products, under this category, are the Tableau Desktop and the Tableau Public.
  2. Sharing Tools: As the name suggests, the purpose of the tool is sharing the visualizations, reports, dashboards that were created using the developer tools. Products that fall into this category are Tableau Online, Server, and Reader.
Let's study all the products one by one.

Tableau Desktop

Tableau Desktop has a rich feature set and allows you to code and customize reports. Right from creating the charts, reports, to blending them all together to form a dashboard, all the necessary work is created in Tableau Desktop.
For live data analysis, Tableau Desktop provides connectivity to Data Warehouse, as well as other various types of files. The workbooks and the dashboards created here can be either shared locally or publicly.
Based on the connectivity to the data sources and publishing option, Tableau Desktop is classified into
  • Tableau Desktop Personal: The development features are similar to Tableau Desktop. Personal version keeps the workbook private, and the access is limited. The workbooks cannot be published online. Therefore, it should be distributed either Offline or in Tableau Public.
  • Tableau Desktop Professional: It is pretty much similar to Tableau Desktop. The difference is that the work created in the Tableau Desktop can be published online or in Tableau Server. Also, in Professional version, there is full access to all sorts of the datatype. It is best suitable for those who wish to publish their work in Tableau Server.

Tableau Public

It is Tableau version specially build for the cost-effective users. By the word "Public," it means that the workbooks created cannot be saved locally, in turn, it should be saved to the Tableau's public cloud which can be viewed and accessed by anyone.
There is no privacy to the files saved to the cloud since anyone can download and access the same. This version is the best for the individuals who want to learn Tableau and for the ones who want to share their data with the general public.

Tableau Server

The software is specifically used to share the workbooks, visualizations that are created in the Tableau Desktop application across the organization. To share dashboards in the Tableau Server, you must first publish your work in the Tableau Desktop. Once the work has been uploaded to the server, it will be accessible only to the licensed users.
However, It's not necessary that the licensed users need to have the Tableau Server installed on their machine. They just require the login credentials with which they can check reports via a web browser. The security is high in Tableau server, and it is much suited for quick and effective sharing of data in an organization.
The admin of the organization will always have full control over the server. The hardware and the software are maintained by the organization.

Tableau Online

As the name suggests, it is an online sharing tool of Tableau. Its functionalities are similar to Tableau Server, but the data is stored on servers hosted in the cloud which are maintained by the Tableau group.
There is no storage limit on the data that can be published in the Tableau Online. Tableau Online creates a direct link to over 40 data sources that are hosted in the cloud such as the MySQL, Hive, Amazon Aurora, Spark SQL and many more.
To publish, both Tableau Online and Server require the workbooks created by Tableau Desktop. Data that is streamed from the web applications say Google Analytics, Salesforce.com are also supported by Tableau Server and Tableau Online.

Tableau Reader

Tableau Reader is a free tool which allows you to view the workbooks and visualizations created using Tableau Desktop or Tableau Public. The data can be filtered but editing and modifications are restricted. The security level is zero in Tableau Reader as anyone who gets the workbook can view it using Tableau Reader.
If you want to share the dashboards that you have created, the receiver should have Tableau Reader to view the document.

How does Tableau work?

Tableau connects and extracts the data stored in various places. It can pull data from any platform imaginable. A simple database such as an excel, pdf, to a complex database like Oracle, a database in the cloud such as Amazon webs services, Microsoft Azure SQL database, Google Cloud SQL and various other data sources can be extracted by Tableau.
When Tableau is launched, ready data connectors are available which allows you to connect to any database. Depending on the version of Tableau that you have purchased the number of data connectors supported by Tableau will vary.
The pulled data can be either connected live or extracted to the Tableau's data engine, Tableau Desktop. This is where the Data analyst, data engineer work with the data that was pulled up and develop visualizations. The created dashboards are shared with the users as a static file. The users who receive the dashboards views the file using Tableau Reader.
The data from the Tableau Desktop can be published to the Tableau server. This is an enterprise platform where collaboration, distribution, governance, security model, automation features are supported. With the Tableau server, the end users have a better experience in accessing the files from all locations be it a desktop, mobile or email.

Excel Vs. Tableau

Both Excel and Tableau are data analysis tools, but each tool has its unique approach to data exploration. However, the analysis in Tableau is more potent than excel.
Excel works with rows and columns in spreadsheets whereas Tableau enables in exploring excel data using its drag and drop feature. Tableau formats the data in Graphs, pictures that are easily understandable.
ParametersExcelTableau
PurposeSpreadsheet application used for manipulating the data.Perfect visualization tool used for analysis.
UsageMost suitable for statistical analysis of structured data.Most suitable for quick and easy representation of big data which helps in resolving the big data issues.
PerformanceModerate speed with no option to quicken.Moderate speed with options to optimize and enhance the progress of an operation.
SecurityThe inbuilt security feature is weak when compared to Tableau. The security update needs to be installed on a regular basis.Extensive options to secure data without scripting. Security features like row level security and permission are inbuilt.
User InterfaceTo utilize excel to full potential, macro and visual basic scripting knowledge is requiredThe tool can be used without any coding knowledge.
Business needBest for preparing on-off reports with small dataBest while working with big data.
ProductsBundled with MS Office toolsComes with different versions such as the Tableau server, cloud, and desktop.
IntegrationExcel integrates with around 60 applicationsTableaus integrated with over 250 applications
Real time data explorationWhen you are working in excel, you need have an idea of where your data takes you to get to know the insightsIn Tableaus, you are free to explore data without even knowing the answer that you want. With the in-built features like data blending and drill-down, you will be able to determine the variations and data patterns.
Easy VisualizationsWhen working in excel, we first manipulate the data that is present and then the visualization such as the different charts, graphs are created manually. To make the visualizations easily understandable, you should understand the features of excel well.Whereas in Tableau, the data is visualized from the beginning.
To conclude, Tableau beats Excel in major areas like the interactive dashboards, visualizations, capabilities to work with large-scale data and many more.

Summary

  • Tableau is a powerful and fastest growing data visualization tool used in the Business Intelligence Industry
  • The Tableau Product Suite consists of 1) Tableau Desktop 2) Tableau Public 3) Tableau Online 4) Tableau Server and Tableau Reader
  • Tableau Desktop has a rich feature set and allows you to code and customize reports
  • In Tableau public, workbooks created cannot be saved locally, in turn, it should be saved to the Tableau's public cloud which can be viewed and accessed by anyone
  • Tableau server is specifically used to share the workbooks, visualizations that are created in the Tableau Desktop application across the organization
  • Tableau online has all the similar functionalities of the Tableau Server, but the data is stored on servers hosted in the cloud which are maintained by the Tableau group.
  • Tableau Reader is a free tool which allows you to view the workbooks and visualizations created using Tableau Desktop or Tableau Public.
  • Tableau connects and extracts the data stored in various places. It can pull data from any platform imaginable.
  • The spreadsheet application used for manipulating the data while Tableau is a perfect visualization tool used for analysis