online tool to edit or extarct the .PSD,.PSB .PNG or .JPG

Statement - Online tools to edit or extarct the images, text, font styles form th ethe .PSD,.PDF and any other Image design files.

Solution :


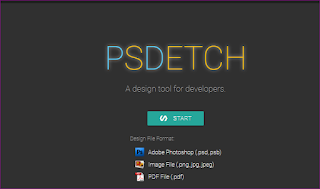
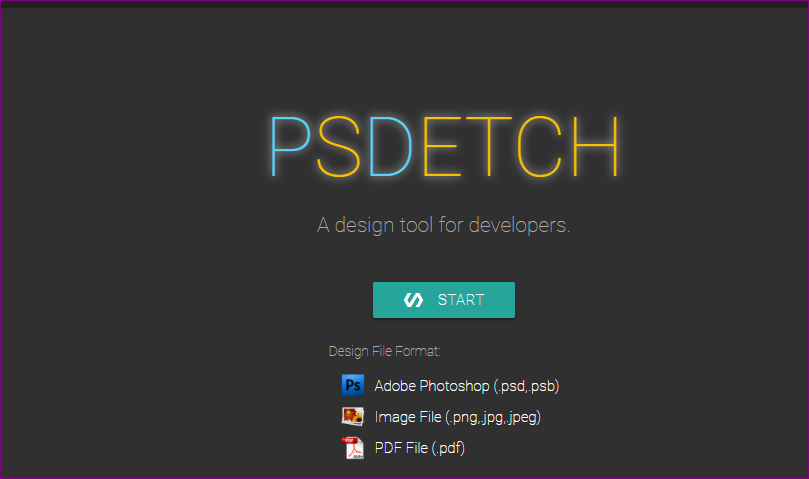
  1. Online Tools : https://studio.psdetch.com/ refer the below screenshot.
  2. Click on start
  3. click to Open to drop the design files as shown in below screenshot.


      4. you can extract, crop. color extract and  layer extraction...etc

How to check whether content is getting served from CDN cache or CDN edge server

Statement - How to check whether content is getting served from CDN cache or CDN edge server


Solution : 
  • Use below online tools to verify the Gzip compression and Cache status from CDN
  • Key in your website URL
  • Observe the results and search for 
  1. Content-Encoding: gzip  This indicates Gzip enabled for the website.
  2. X-Cache: Hit from cloudfront - This indicate when requests are served from the closest CloudFront/CDN edge location.
  3. X-Cache:Miss from cloudfront" when the request is sent to the origin and "Miss" requests might be slower to load because of the additional step of forwarding to the origin.
  4. X-Frame-Options: SAMEORIGIN - provide clickjacking protection by not allowing rendering of a page in a frame. This can include rendering of a page in a fram,iframe, or object The SAMEORIGIN directive allows the page to be loaded in a frame on the same origin as the page itself.


Domain Name
https://www.abc.com/
Compressed size
5662
Uncompressed size
31897

Was saved by compressing this page with GZIP.
Header Information
HTTP/1.1 200 OK
Content-Type: text/html; charset=UTF-8
Content-Length: 5662
Connection: keep-alive
Date: Fri, 07 Dec 2017 10:51:12 GMT
Server: Apache
X-Frame-Options: SAMEORIGIN
Cache-Control: public, max-age=0, s-maxage=86400
Accept-Ranges: bytes
Content-Encoding: gzip
x-platform: cf5-3
Vary: Accept-Encoding
Age: 89
X-Cache: Hit from cloudfront
Via: 1.1 68e4011ca1c00bec92bb202e1ddce131.cloudfront.net (CloudFront)
X-Amz-Cf-Id: -fKsscKYxW5jusS5LZ-f3sqIHIG34RJXydvw-JlXczZkF3168snvjQ==

Different Types of Agile Reports in JIRA

  • Burndown Chart
    Track the total work remaining and project the likelihood of achieving the sprint goal. This helps your team manage its progress and respond accordingly.
  •  
     
  • Burnup Chart
    Track the total scope independently from the total work done. This helps your team manage its progress and better understand the effect of scope change.
  •  
     
  • Sprint Report
    Understand the work completed or pushed back to the backlog in each sprint. This helps you determine if your team is overcommitting or if there is excessive scope creep.
  •  
     
  • Velocity Chart
  • Track the amount of work completed from sprint to sprint. This helps you determine your team's velocity and estimate the work your team can realistically achieve in future sprints.
  •  
     

  • Cumulative Flow Diagram
    Shows the statuses of issues over time. This helps you identify potential bottlenecks that need to be investigated.
  •  
      

  • Version Report
    Track the projected release date for a version. This helps you monitor whether the version will release on time, so you can take action if work is falling behind.
  •  
     
  • Epic Report
    Understand the progress towards completing an epic over time. This helps you manage your team's progress by tracking the remaining incomplete/unestimated work.


  • Control Chart
    Shows the cycle time for your product, version or sprint. This helps you identify whether data from the current process can be used to determine future performance.
  •  
      
  • Epic Burndown
    Track the projected number of sprints required to complete the epic (optimized for Scrum). This helps you monitor whether the epic will release on time, so you can take action if work is falling behind.
  •  
  • Release Burndown
    Track the projected release date for a version (optimized for Scrum). This helps you monitor whether the version will release on time, so you can take action if work is falling behind.

Issue analysis

  • Average Age Report
    Shows the average age of unresolved issues for a project or filter. This helps you see whether your backlog is being kept up to date.
  •  
  • Created vs. Resolved Issues Report
    Maps created issues versus resolved issues over a period of time. This can help you understand whether your overall backlog is growing or shrinking.
  •  
     
  • Pie Chart Report
    Shows a pie chart of issues for a project/filter grouped by a specified field. This helps you see the breakdown of a set of issues, at a glance.
  •  

  • Recently Created Issues Report
    Shows the number of issues created over a period of time for a project/filter, and how many were resolved. This helps you understand if your team is keeping up with incoming work.
  •  
     
  • Resolution Time Report
    Shows the length of time taken to resolve a set of issues for a project/filter. This helps you identify trends and incidents that you can investigate further.
  •  
  • Single Level Group By Report
    Shows issues grouped by a particular field for a filter. This helps you group search results by a field and see the overall status of each group.
  •  
     
  • Time Since Issues Report
    For a date field and project/filter, maps the issues against the date that the field was set. This can help you track how many issues were created, updated, etc, over a period of time.

Forecast & management

  • Time Tracking Report
    Shows the original and current time estimates for issues in the current project. This can help you determine whether work is on track for those issues.
  •  
  • User Workload Report
    Shows the time estimates for all unresolved issues assigned to a user across projects. This helps you understand the user's workload better.
  •  
     
  • Version Workload Report
    Shows the time estimates for all unresolved issues assigned to a version, broken down by user and issues. This helps you understand the remaining work for the version.

Other

  • Workload Pie Chart Report
    A report showing the issues for a project or filter as a pie chart.